TargetLynx residuals plot displays incorrect values for a Log calibration - WKB73159
SYMPTOMS
- The residuals plot displays incorrect values in a Log calibration plot
- This issue is seen in multiple versions of MassLynx
ENVIRONMENT
- MassLynx
- TargetLynx
CAUSE
Unknown
FIX or WORKAROUND
There is currently no fix or workaround.
Note that this is only a graphical issue. The calculated values display correctly in the summary table.
ADDITIONAL INFORMATION
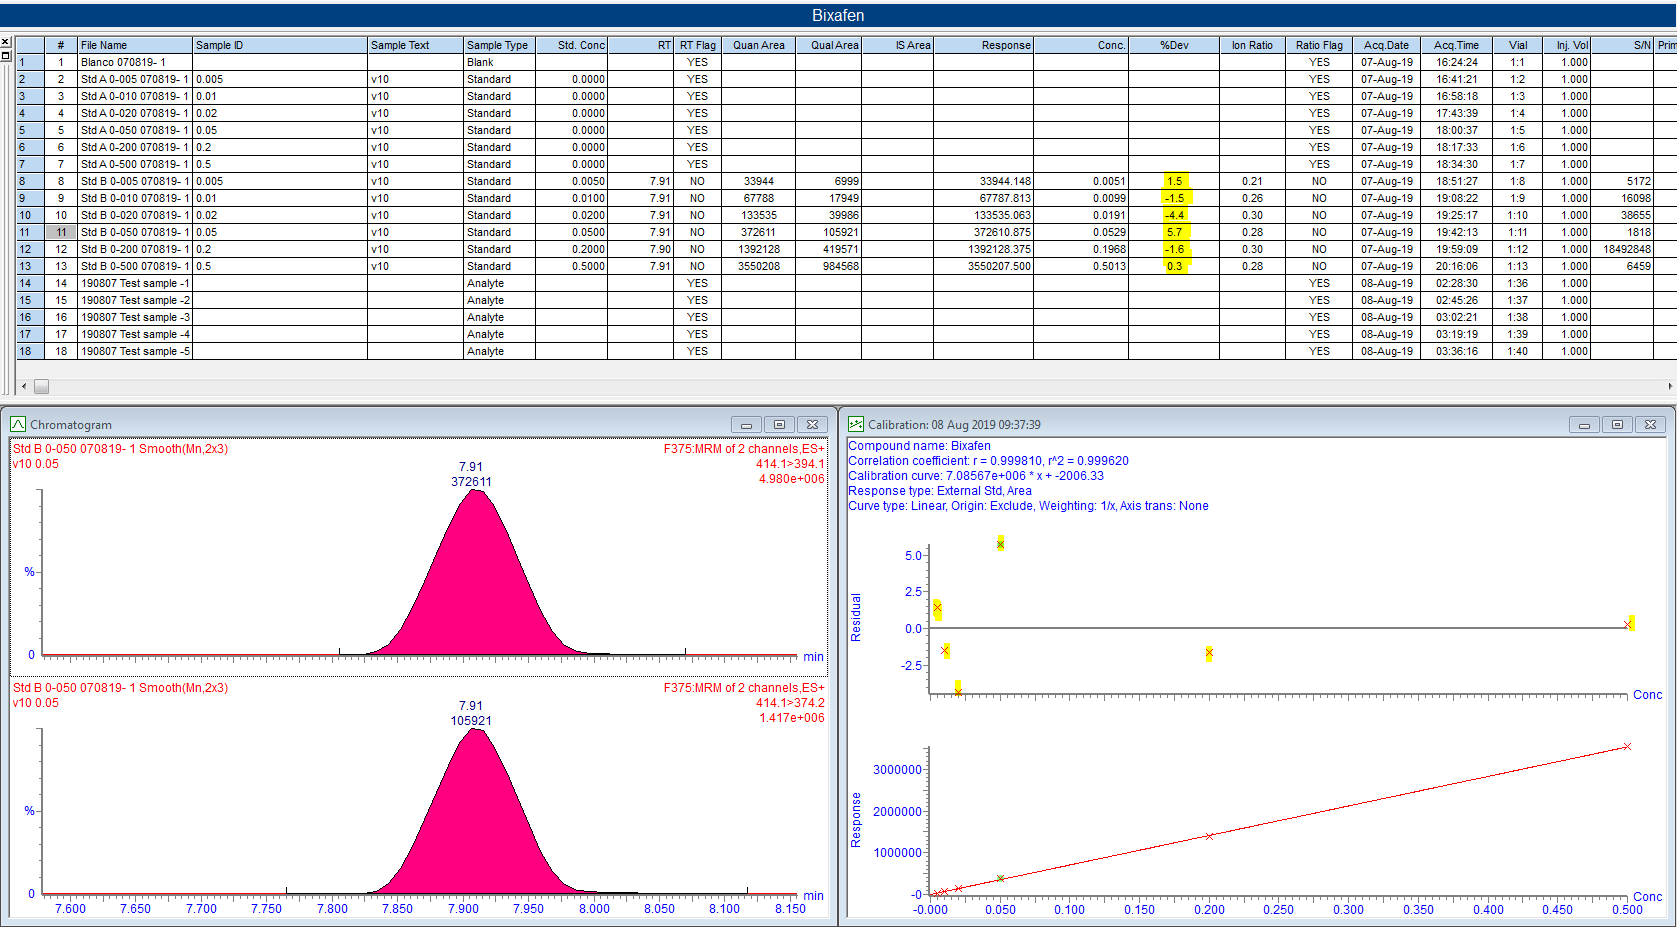
The residuals plot normally displays the same values as in the summary table. This is shown below for a linear calibration curve. The calibration curve comprises six points. The residuals values in the summary table are identical to the graphical representation in the residuals plot and to the values in the pop-up message that appears when you hover over a calibration point with your mouse pointer.
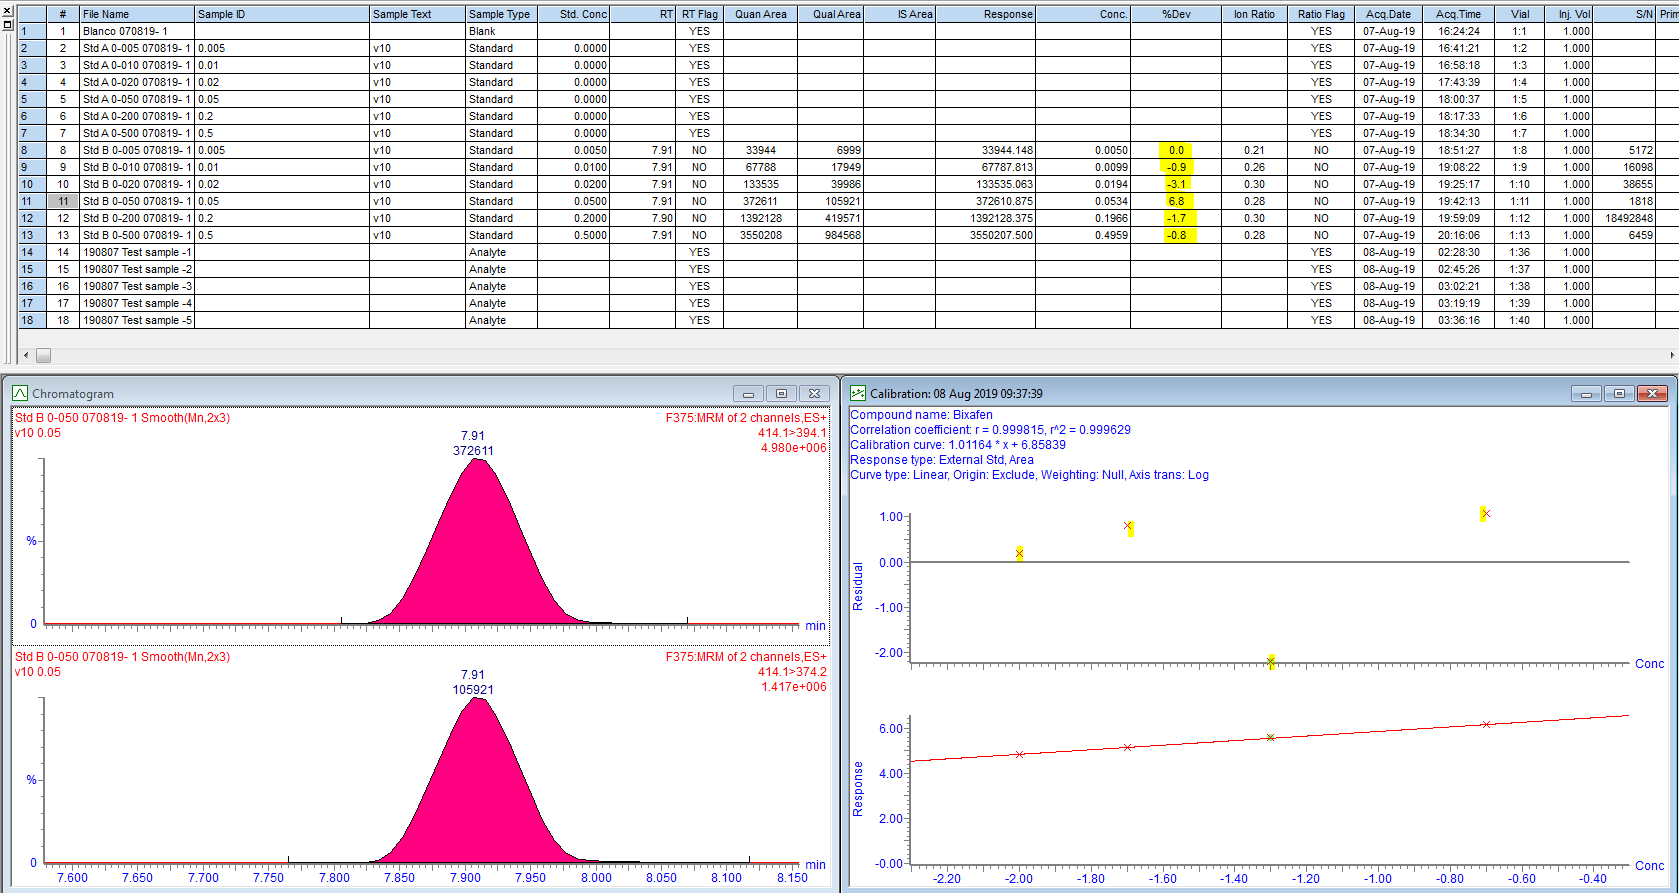
However, when a Log-type calibration curve is used, the residuals values correctly display in the summary table but not in the residuals plot or the pop-up highlight message. Moreover, in some cases not all calibration points are shown on the residuals plot or the response curve. In this case, only four out of the six points are shown.
id73159, MLYNX, MLYNXV41, SUPMM, TARLYNX41