How to work with 3D PDA data in Empower Software (Part 2) - Tip135
OBJECTIVE or GOAL
Welcome back to Get Empowered! In the last Empower tip-of-the-week post for Empower Chromatography Data Software, we learned about the critical parameters in the Instrument Method which have an effect on data collected that will be used for determining peak purity (Tip #134).
In this week’s tip, we will explore the use of MaxPlot as it relates to determining peak purity. (Refer to Tip #52 which reviews deriving MaxPlot).
Let’s get started.
ENVIRONMENT
- Empower
PROCEDURE
It is recommended to keep peaks for which you want to determine peak purity, under 1.0AU. Why? At high absorbances a combination of effects can produce slight departures (approx. 1%) from Beer’s law because of photometric error. Although these errors at this level have a negligible effect on quantitation, they can be a source of spectral inhomogeneity and result in distortion of spectra. Therefore, to minimize the effects of photometric error for the spectral contrast math used to determine peak purity, the maximum spectral absorbance of a compound should be less than 1.0AU.
To illustrate this:
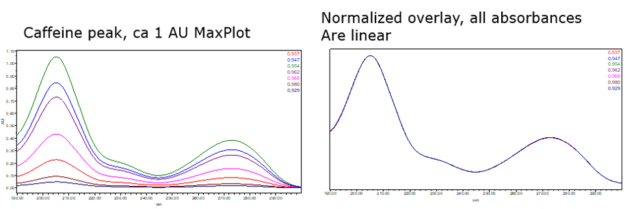
- Here is an overlay of spectra for caffeine at various concentrations. Once we normalize the plot, we see a nearly perfect overlay of the spectra indicating spectral homogeneity.
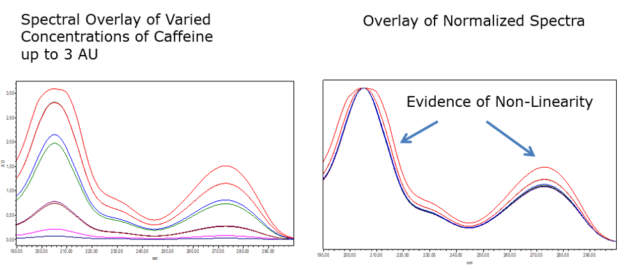
- In this example, we exceed 1.0AU and once normalized, the spectra do not overlay well indicating spectral inhomogeneity.
Now let’s discuss MaxPlot:
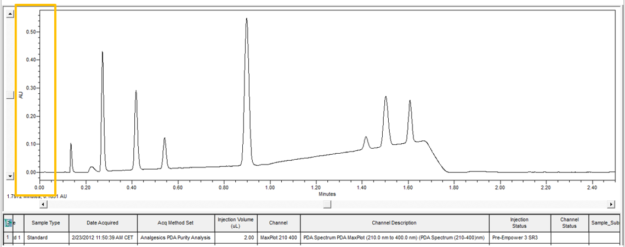
- MaxPlot plots each point in time at the maximum absorbance across the wavelength range. In this example, we see that all peaks are under 1.0AU.
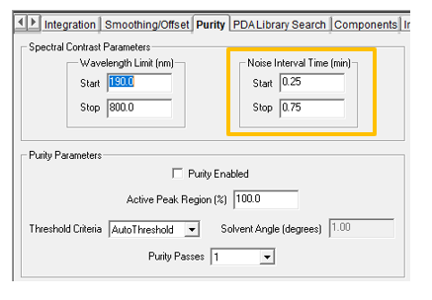
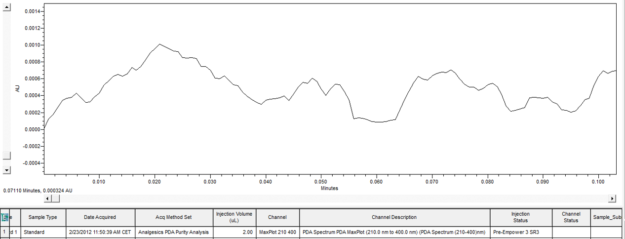
- A parameter that needs to be determined is the ‘Noise Interval’ found on the Purity tab of the Processing Method. We need to identify a small section of the baseline which is free of absorbance across the wavelength range and it must contain a minimum of 12 spectra. MaxPlot is the easiest way to identify this interval.
- Here is a section of baseline which only displays noise and no significant absorbance across the wavelength range. At an interval of 0.1 minutes (6 seconds) with a sampling rate of 20 points per second there are 120 spectra.
Now that we know our peaks are under 1.0AU and we’ve identified a noise interval, we can create a Processing Method and we will do that in the next Empower Tip of the Week.
It’s that easy!
ADDITIONAL INFORMATION
This procedure can be followed using the QuickStart or Pro interface.
id74532, EMP2LIC, EMP2OPT, EMP2SW, EMP3GC, EMP3LIC, EMP3OPT, EMP3SW, EMPGC, EMPGPC, EMPLIC, EMPOWER2, EMPOWER3, EMPSW, SUP