Processing Methods - CE data - wkb261397
OBJECTIVE or GOAL
Create a processing method for CE data.
ENVIRONMENT
- Empower
- Empower Tip of the Week #327
PROCEDURE
STEP 1
Select either CE (Capillary Electrophoresis) or CIA (Capillary Ion Analysis) from the Processing Type list. One difference between an LC Processing Method and a CE Processing Method can be found on the Components tab (Figure 1).
Let’s define these parameters:
- Migration Time:
- For CE type, the Migration Time is equal to the migration time of the Apex of the peak.
- For CIA type, the Migration Time is the migration time midway between the Start and End times of a peak.
- MT Window is analogous to RT Window for an LC Processing Method.
- MT Reference is analogous to RT Reference for an LC Processing Method.
- Rel MT Reference is analogous to Rel RT Reference for an LC Processing Method.
- Note that the y axis for the calibration curve is Time Corrected Area.

STEP 2
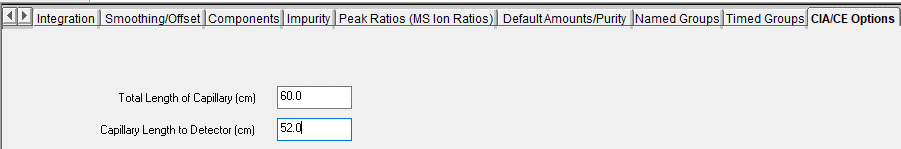
The other difference is the addition of the CIA/CE Options tab (Figure 2).
Let’s define the parameters needed to calculate analyte mobility and deposition time of a peak:
- Total Length of Capillary (cm)
- Capillary Length to Detector (cm)
STEP 3
To calculate analyte mobility and/or deposition time, you need to create a custom Sample Field for RunVoltage (Figure 3).

STEP 4
Be sure to populate the RunVoltage field in kV, in the Sample Set Method (Figure 4).

STEP 5
Here is the Result for a sample (Figure 5). Let’s look at how these fields are calculated:
- Migration Time – as defined in Step 1a.
- Relative MT – the Migration Time of the peak of interest minus the Migration Time of the MT Reference peak.
- MT Ratio – the Migration Time of the peak of interest divided by the Migration Time of the MT Reference peak.
- Time Corr. Area – Time Corrected Area is the peak area divided by the Migration Time of the peak. Empower uses full precision for area and migration time to make this calculation.
- %Time Corr. Area – Time Corrected Area of a peak divided by the total Time Corrected Area in the electropherogram times 100.
- Mobility – Calculated as (length of the capillary to the detector x total capillary length)/(migration time to detector x 60 x RunVoltage x 1000). The units are cm2/V*sec.
- Deposition Time – Deposition Time is the elapsed time after injection when an electrophoretic band peak exits from the capillary and is deposited on the Membrane Fraction Collector. It is calculated as (migration time to detector x total capillary length)/capillary length to detector.
Why do we see Peak Code Q07 for every peak? Because there is no injection volume with CE, Empower cannot calculate concentration by taking the amount divided by injection volume.

ADDITIONAL INFORMATION
This can be done with either the Pro or QuickStart interface.