How to report the maximum pressure during a chromatographic run (Part 15) - Tip97
OBJECTIVE or GOAL
Welcome back to Get Empowered! In the last Empower tip-of-the-week post for Empower Chromatography Data Software, we learned how to report pressure at a certain time point in the chromatogram (Tip #96).
Creating Custom Fields in Empower:
- #82: The basic steps on creating a Custom Field
- #83: How to create a Custom Sample Set Field
- #84: How to create a Component Custom Field
- #85: How to create a Peak Custom Field
- #86: How to copy a Custom Field from one project to another
- #87: How to modify a Custom Field
- #88: How to create a Result Custom Field
- #89: How to modify a Custom Field that applies to specific samples and/or specific peaks
- #90: How to use Empower to evaluate whether the sample meets specific criteria
- #92: How to create one custom field to determine a sample pass/fail
- #93: How to create an Intersample Custom Field
- #94: How to create Intersample Custom Fields with a summary function
- #95: The difference between Summarize Custom Fields and Summarize Custom Fields Incrementally
- #96: How to report the pressure and temperature at a certain time point within a chromatogram
This week, I want to share a follow-up question I received from last week’s tip (Tip #96):
Q: How can I report the maximum pressure (or other channel, such as temperature) during a chromatographic run?
A: This is important to know because you do not want to exceed the pressure recommendations from the column manufacturer.
In this tip, I will show you how to report the maximum pressure during a chromatographic run (Part 15).
Let’s get started.
ENVIRONMENT
- Empower
PROCEDURE
- Create a Peak Type Custom Field, ‘data type real’. Working with ‘YValue’ as we did in the last tip, simply enter ‘Retention Time’ into the brackets rather than a specific retention time (Figure 1).
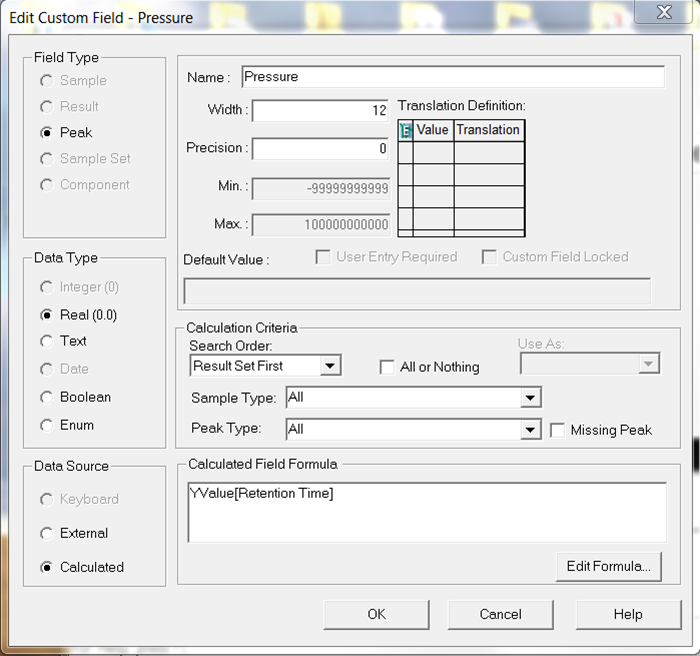
Figure 1
- Create a Result Type Custom Field, ‘data type real’. Use the MAX function to report maximum pressure (Figure 2).
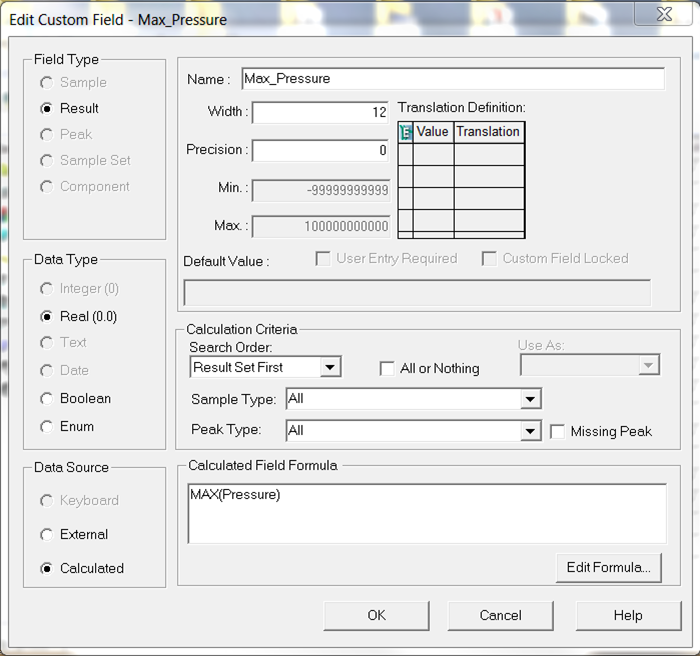
Figure 2
- You’ll notice that I applied the Method Set to an injection and the pressure at various time points is displayed (Figure 3).
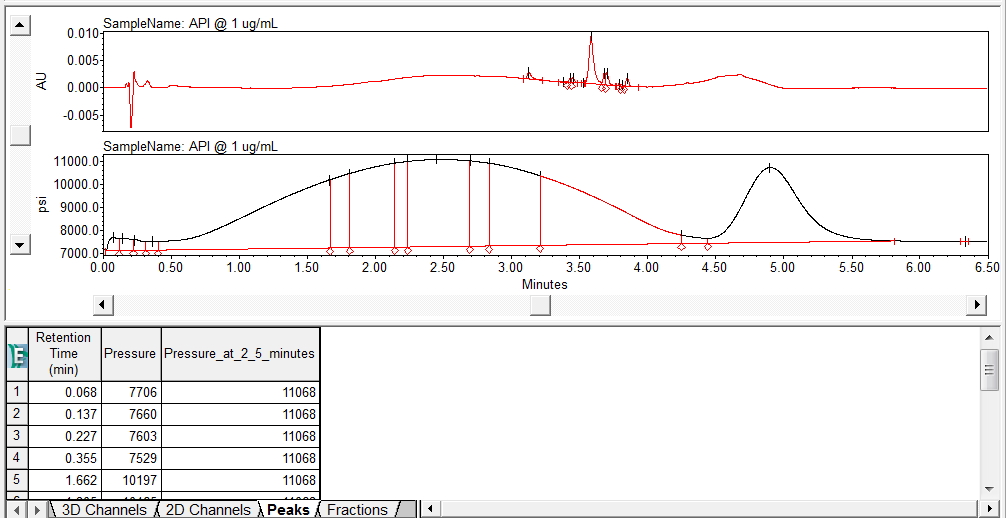
Figure 3
- In the Results window, view the maximum pressure in the Chromatogram Result table (Figure 4).
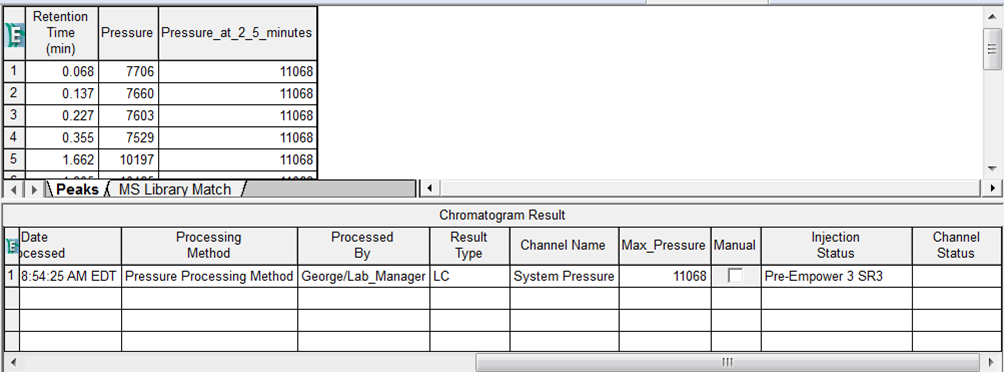
Figure 4
It’s that easy!
ADDITIONAL INFORMATION
Final note: This procedure can be followed using the QuickStart or Pro interface.
id56950, EMP2LIC, EMP2OPT, EMP2SW, EMP3GC, EMP3LIC, EMP3OPT, EMP3SW, EMPGC, EMPGPC, EMPLIC, EMPOWER2, EMPOWER3, EMPSW, SUP