Noisy leading spectrum in purity view of mass analysis window in Empower using an optical detector and a MS in series - WKB71256
Article number: 71256
SYMPTOMS
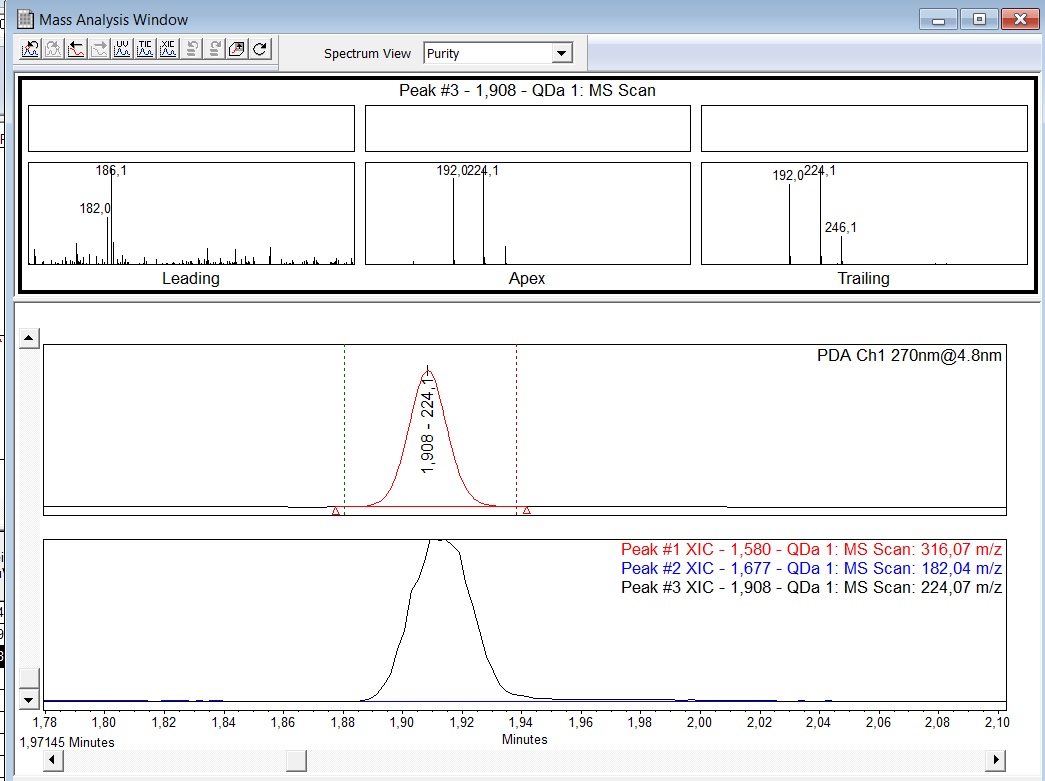
- Leading spectrum in purity view of the mass analysis window is noisy
- Trailing spectrum is not noisy
- Optical detector and mass spectrometer are installed in series (no ISM/split module)
ENVIRONMENT
- Empower
CAUSE
Because the two detectors are installed in series, the signal reaches the optical detector before it reaches the mass spectrometer. This causes a difference in retention time that needs to be compensated for during combined processing of optical and MS data.
FIX or WORKAROUND
- Determine the time difference between the optical and MS detection in the mass analysis window by comparing the UV and TIC/XIC traces. In the example screenshot below, the delay is approximately 0.005 minutes.
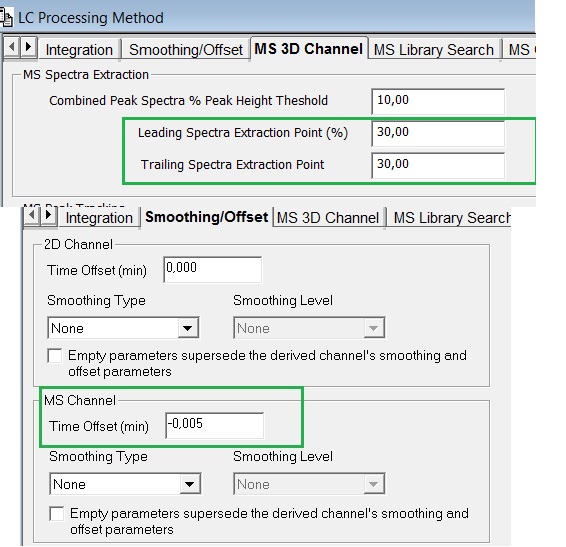
- In the processing method, enter the observed time difference as a negative value in the MS Channel Time offset of the Smoothing/Offset tab. It is recommended that you set the leading and trailing spectra extraction points to 30% (default 10%) to avoid MS spectra extraction from the extreme ends of the front and tail of the peak.
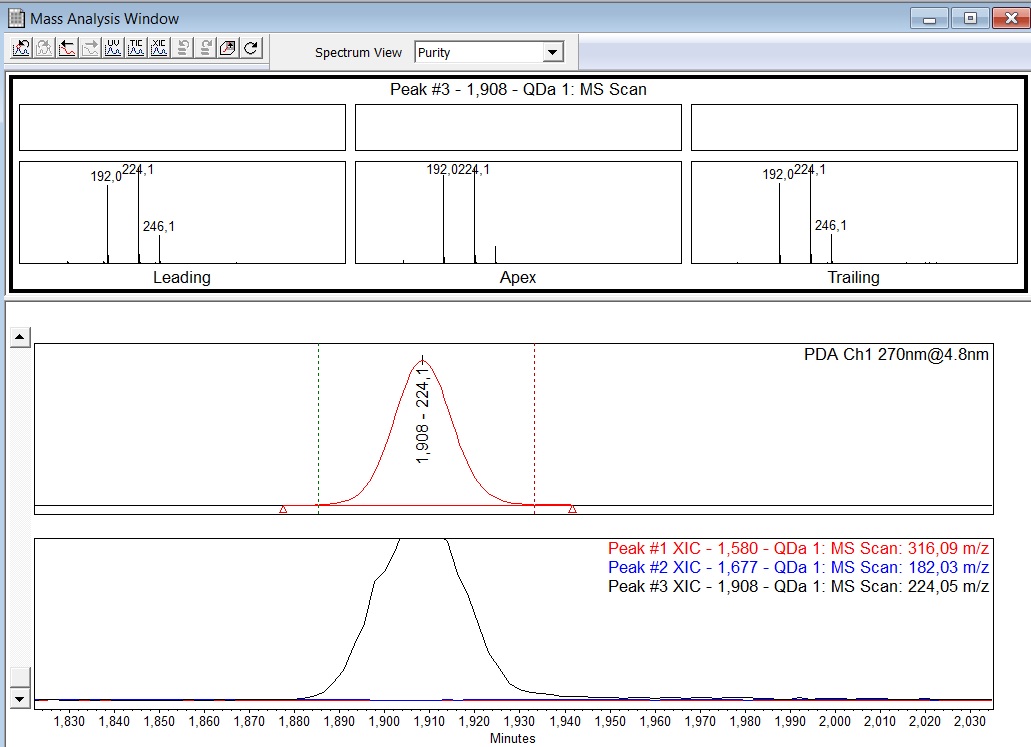
- Reprocess the data; data signals of optical and MS detection now align, and both leading and trailing MS spectra are free of noise.
ADDITIONAL INFORMATION
id71256, A-SQ, A-SQ, EMP2LIC, EMP2OPT, EMP2SW, EMP3GC, EMP3LIC, EMP3OPT, EMP3SW, EMPGC, EMPGPC, EMPLIC, EMPOWER2, EMPOWER3, EMPSW, QDA, SQD, SQD2, SUP