Why is an apparent unknown peak between two unresolved peaks automatically picked up and integrated using Apex Track? - WKB219994
Article number: 219994
ENVIRONMENT
- Empower
- Apex Track
ANSWER
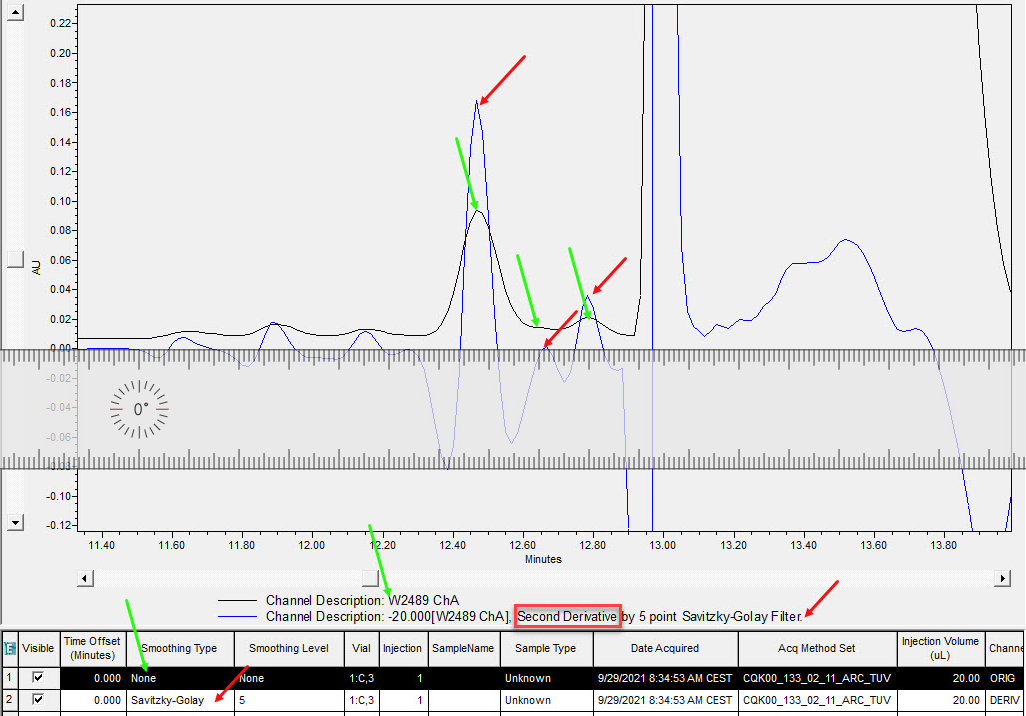
The image below shows the chromatogram and the overlaid second derivative plot.
Looking at the second derivative plot for the chromatography, the apex of the middle unknown is not above the zero point. Therefore, it is not identified because:
- It is likely close or below a threshold value of zero, so it is not identified as an apex.
- There are no inflection points because it is not above zero and does not cross zero.
- The peaks on either side have maxima above zero and have two inflection points, so they are detected.
ADDITIONAL INFORMATION
Per the Apex Track white paper - https://www.waters.com/waters/library.htm?cid=511436&lid=1546221&lcid=1546222&locale=en_US:
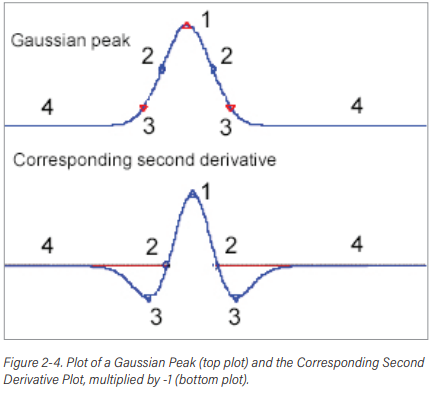
Because the second derivative of a chromatogram is affected by the baseline noise in the chromatogram, not all maxima in the second derivative are peaks.
- The peak apex (#1) is a local maximum of curvature in the second derivative plot.
- The points where the curvature crosses zero are the inflection points (#2); two inflection points always straddle each apex.
- The upslope points (#3) are local minima in the second derivative.
- The baseline region (#4) has zero curvature.
id219994, baseline ripple, EMP2LIC, EMP2OPT, EMP2SW, EMP3GC, EMP3LIC, EMP3OPT, EMP3SW, EMPGC, EMPGPC, EMPLIC, EMPOWER2, EMPOWER3, EMPSW, SUP